Market Update
March 2, 2020 - 7 minutes readIn our Fourth Quarter report distributed only one month ago, we lead with the phrase “What a Difference a Year Makes,” essentially highlighting the strong year for equities in 2019 following a sharp drop in the fourth quarter of 2018.
Only 12 days ago, on February 19, the Standard & Poor’s 500 reached an all-time high. Today we are sending you this note because world markets, ours included, have taken a pretty good hit due largely to the potential impact of the Coronavirus on world economies. We certainly do not have a crystal ball as to the severity of this virus and how long and extensive it might be, but for perspective, it might be helpful to show you the chart below provided by our friends at Strategas Research which details the impact on our domestic stock market from past viruses.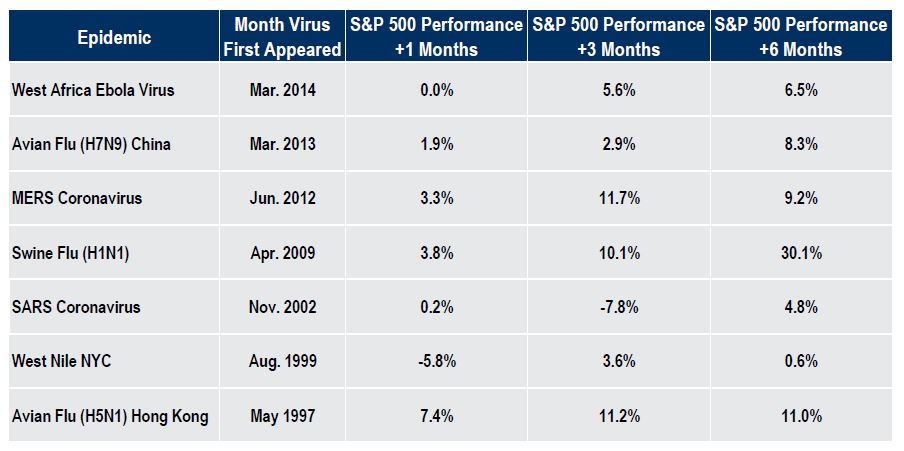
Obviously, this correction over the past 12 days (8 trading days) has been more severe than during past viruses. In fact, it has been the fastest stock market correction in our history. We would argue that there are reasons for this extreme reaction, including the price strength in the market which carried valuations to level where they could not be called cheap any longer. Also, the continued importance of automated trading systems has increasingly, we believe, added a great deal more volatility to the market. Finally, the worldwide scope of this virus has raised additional warning signs.
Over the past 12-14 months we were asked by clients more than once “why do we even own any bonds?” Our response was always the same: “While bonds are not expected to be our highest rate of return vehicle over the long-term we own the asset class to provide diversification and stability to the portfolio.” That has certainly been the case these past twelve days. The same is true for our position in gold. It too has provided great stability and is up in price.
The near-term will continue to see the shake-out from the Coronavirus. The potential for a significant economic slowdown exists due to the outsized precautions taken by the Chinese government and other countries. Supply chain disruptions (Apple, Microsoft) and transaction impacts (Mastercard) are still undetermined and the response from companies (less corporate travel, store shutdowns in China) is more drastic than in the past. We expected GDP and earnings estimates to come down. Whether this leads to a recession domestically is still hard to gauge. There could well be little or no EPS growth this year in the U.S. and declines in earnings for some businesses (airlines, hotels, cruise lines). We simply don’t know enough to get carried away and start selling our long (or short) term positions. We have pretty much sat tight with our stock holdings as we like where we stand with high-quality, dividend-growing, strong free cash flow companies in our large-cap strategy diversified across sectors. Right now this Core Equity strategy yields 2.9% which compares to a 1.6% 30-year U.S. Treasury yield. In our Growth strategy, we continued to reduce risk in January and February. We gradually further reduced exposure to technology, where valuations started to look somewhat stretched, and increased exposure to a more defensive healthcare sector. We also carry a slightly higher cash balance, which we will look to put to work, as more attractive opportunities emerge during the current market correction.
Finally, two interesting observations from the past nine days. As talk of a recession in the U.S. has gained a little more traction the yield curve has actually steepened. The yield curve is really a way to measure bond investors’ feelings about risk. A normal yield curve is one where shorter maturities provide interest rates that are lower than longer maturities. After all, you should expect to earn a higher yield the longer that you commit funds. An inverted yield curve, where long rates are lower than short rates has often, but not always, been a precursor of a recession. On February 19, the difference between the 10-year U.S. Treasury and the 2-Year Treasury was 14.4 basis points. Today, the spread is up to 26.0 basis points. One would think that with more recession fears the yield curve would move toward inversion, not steepening. Second, the U.S. stock market (S&P 500) has nicely outperformed markets outside of the U.S. (by over 5% annually over the past 10 years). Over the past 9 trading days the stock markets in the non-U.S. world have outperformed the S&P 500. Considering that non-U.S. markets are more volatile and a large portion of them (Asia) are more in the crosshairs of the Coronavirus, one would think that the reverse would be true. Perhaps this reflects the strong relative performance of our market heading into the high of February 19. It still strikes us as ironic.
As always, during periods of high uncertainty as we are in today, the saga will have plenty of chapters ahead of it. We could see the Federal Reserve and other Central Banks take action on interest rates. Money supply may well increase. Tariffs may be adjusted. And, by the way, we have an election coming up in a little over eight months. Stay tuned